Data Analytics vs Data Visualisation

Share This Article
Global Software Development Rates: An Overview
Table of Contents
Subscribe to Our Blog
We're committed to your privacy. SayOne uses the information you provide to us to contact you about our relevant content, products, and services. check out our privacy policy.
Difference Between Data Analytics and Data Visualisation
The origin of the term 'Big Data' happened around the time of the internet boom. It referred to the massive amount of data that was getting generated, and was beyond the capabilities of traditional database management systems to gather, integrate, analyze, and infer. But over the years, with the rise of artificial intelligence and machine learning technologies, Big Data or Data Science has emerged into full-blown technologies capable of analyzing, processing, and revealing insights and relationships within the enormous data sets.
Data is one of the most significant and decisive forces of our modern-day business ecosystem. Data Analytics and Data Visualisation are two concepts of data science that are often interchanged by enterprises, thinking them to be serving the same purpose, which is helping make sense of our data. In a way, they are serving the same purpose but are two different parts of the same machinery, with each serving a specific and significant purpose that can't be replaced with each other.
Also read: How Business Intelligence turns your data into Business Opportunity
Data Analytics processes data to identify patterns or relationships between events and data-sets, to help businesses understand the 'WHYs' to change 'HOW' enterprises can make better decisions that are factual and data-backed.
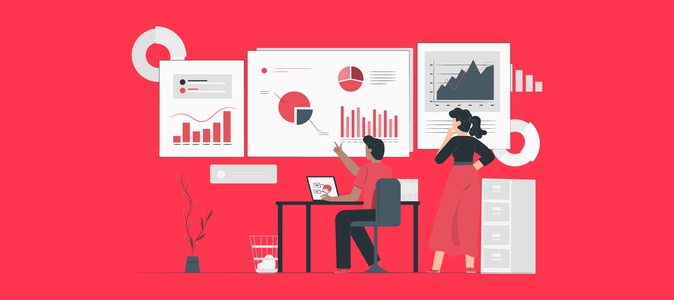
Data Visualisation, on the other hand, gives the data visual representation in the form of charts, graphs, etc. that makes it more accessible or readable for the users. Even though both Data Analytics and Data Visualisation provide a visual interface, the prime difference is that the former processes the data on a deeper level, while the latter is more of surface treatment.
Read more: 10 invisible secrets of Data Scientists
Data Mining Algorithms:
Raw data by nature is messy, scattered, and unorganized. Data analytics uses powerful data mining tools to gather, consolidate, and structure it into a central data warehouse before it processes. Whereas Data Visualisation focuses more on how meaningfully it can represent data and less on the quality of the data that it is fed to its processing engine. And the quality of the visual representation is as good as the quality of the raw data.
Data Processing Algorithms:
Data Analytics can be Predictive, Prescriptive, and Diagnostic. After gathering, compiling, and cleansing the data, it is processed with multiple highly complex calculations and formulas simultaneously for real-time inference. As mentioned in the previous point, data visualization converges on the visual aspect of the outcome and not on how well the data is processed to derive the visual result.
Read more: Why Chatbots will be critical for the future of Business Intelligence
Why Businesses Need Both Data Visualisation and Data Analytics
Data Analytics and Data Visualisation function like the back-end and front-end of a software framework. Banking, retail, aviation, hospital, and pretty much every industry is using data analytics and data visualization to make better-informed decisions and create business-efficient processes that serve their business as well as their customers.
Modern-day enterprises need data analytical tools that can offer real-time processing to derive meaningful insights and data visualization dashboard that makes these insights accessible, readable, and shareable. The key is to strike the right balance between the two entities to drive your Business Intelligence engine.
SayOne data analytics and visualization tools offer you the right mix of the two entities to help you make and see more sense and meaning in your business data.
Get in touch for a FREE consultation on how you can transform your business with data
Share This Article
Subscribe to Our Blog
We're committed to your privacy. SayOne uses the information you provide to us to contact you about our relevant content, products, and services. check out our privacy policy.

